Navigating the volatile world of cryptocurrency trading requires a keen understanding of market trends. This article will equip you with the knowledge of 5 essential trading indicators every serious crypto trader should know. Mastering these indicators – including RSI, MACD, moving averages, Bollinger Bands, and the Awesome Oscillator – can significantly improve your crypto trading strategy, helping you identify potential buy and sell signals and ultimately boost your profitability. Whether you’re a seasoned crypto investor or just starting your journey, understanding these crucial technical indicators is paramount to success in the dynamic cryptocurrency market.
Moving Averages (MA)
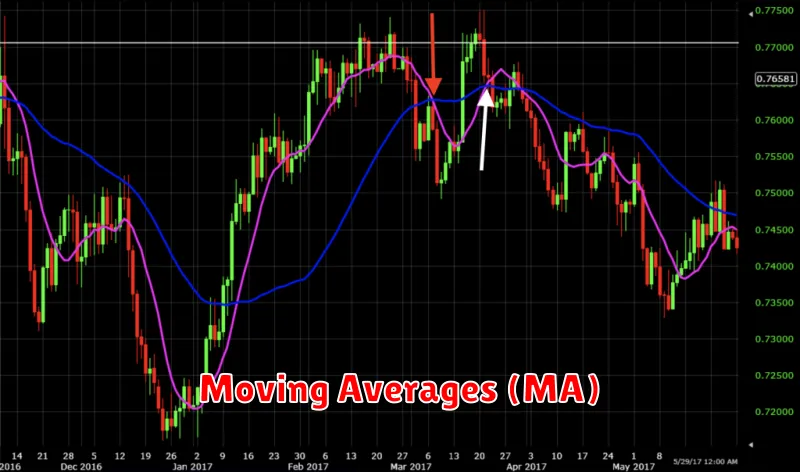
Moving averages are widely used technical indicators in finance that smooth out price data by averaging prices over a specific period. This helps to identify trends and filter out noise in the price action.
There are several types of moving averages, each with its own characteristics and applications. The most common include simple moving averages (SMA), exponential moving averages (EMA), and weighted moving averages (WMA). The choice of which moving average to use depends on the individual trader’s trading style and investment goals.
Simple moving averages (SMA) calculate the average price over a defined number of periods. They are easy to understand and calculate, but they are also relatively slow to react to price changes. Exponential moving averages (EMA) give more weight to recent prices, making them more responsive to recent price movements than SMAs. This responsiveness can be advantageous, but it also means EMAs are more susceptible to false signals.
Weighted moving averages (WMA) assign different weights to each price in the calculation, typically giving more weight to recent prices. This allows for a balance between responsiveness and smoothness. The specific weights used can be adjusted to fine-tune the indicator’s sensitivity.
Regardless of the type of moving average used, the period chosen significantly influences the results. A shorter period will create a more responsive, but potentially more volatile, moving average, while a longer period will produce a smoother, slower-moving average. Choosing the appropriate period requires careful consideration of the asset being analyzed and the trader’s time horizon.
Traders often use moving averages in conjunction with other technical indicators to confirm trading signals or identify potential support and resistance levels. They can also be used to identify trend reversals or momentum changes. However, it’s crucial to remember that moving averages are lagging indicators, meaning they react to price changes after they occur.
In conclusion, moving averages are valuable tools for technical analysis but should be used in conjunction with other forms of analysis and risk management strategies. Understanding the different types of moving averages and their characteristics is vital for effective application in trading decisions.
Relative Strength Index (RSI)
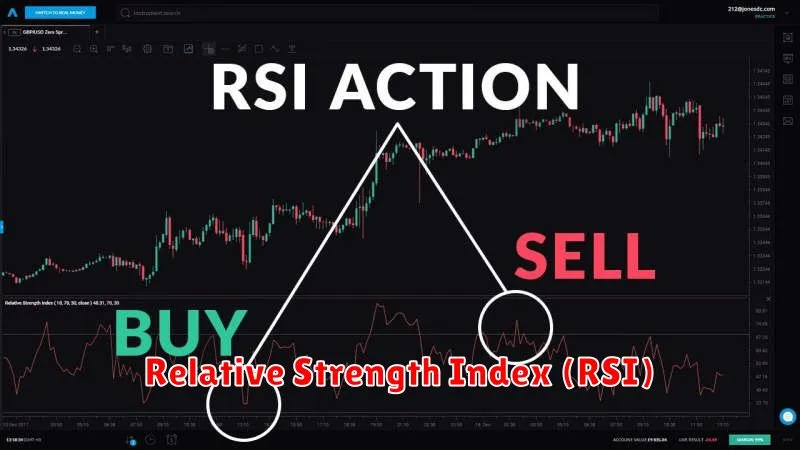
The Relative Strength Index (RSI) is a momentum indicator used in technical analysis that measures the magnitude of recent price changes to evaluate overbought or oversold conditions in the price of a stock or other asset. It is displayed graphically as an oscillator, which means it fluctuates between two extremes.
The RSI is calculated using the average gains and losses over a specified period, typically 14 periods. These periods can be days, weeks, or any other time frame depending on the user’s preferences. A higher value signifies stronger upward momentum, while a lower value suggests stronger downward momentum.
Interpretation of RSI values is generally as follows:
- RSI above 70 is generally considered to be in overbought territory, suggesting a potential price reversal to the downside. This doesn’t guarantee a downturn, but rather indicates higher probability.
- RSI below 30 is generally considered to be in oversold territory, suggesting a potential price reversal to the upside. Again, this is not a guaranteed signal, just a probability indicator.
- RSI between 30 and 70 is considered to be in a neutral range. The price trend may continue, or a reversal may occur.
It’s crucial to remember that the RSI is not a standalone trading signal. It’s most effective when used in conjunction with other technical indicators and analyses to confirm trading decisions. False signals are possible, and relying solely on the RSI can lead to losses. Experienced traders often use the RSI to identify potential entries and exits within the context of a larger trend.
Limitations of RSI include its sensitivity to periods of consolidation where the price remains relatively stable and its susceptibility to whipsaws in highly volatile markets. Proper understanding of market context is paramount to effective utilization.
In summary, the RSI is a valuable tool for traders and investors seeking to gauge momentum and identify potential overbought or oversold conditions. However, it should be used prudently and in conjunction with other forms of market analysis for optimal results.
Bollinger Bands
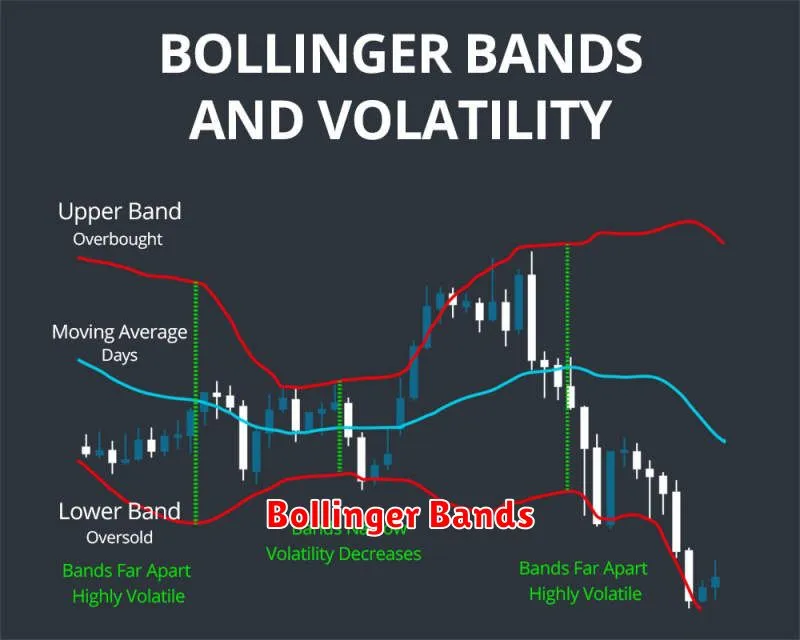
Bollinger Bands are a technical analysis tool developed by John Bollinger. They are used to measure the volatility of a financial instrument like stocks or forex. The bands consist of three lines: a simple moving average (SMA) and two standard deviation bands above and below the SMA.
The middle band represents a simple moving average, typically a 20-period SMA. This line provides a measure of the average price over the specified period. The upper and lower bands are calculated by adding and subtracting two standard deviations of the price from the SMA. The standard deviation measures the dispersion or volatility of the price around the moving average.
Interpreting Bollinger Bands involves observing the price action relative to these three lines. When the price touches or breaks through the upper band, it often suggests a period of overbought conditions, implying a potential price reversal to the downside. Conversely, prices touching or breaking through the lower band might indicate oversold conditions, suggesting a potential price reversal to the upside.
The width of the bands also provides valuable insights. Narrow bands suggest low volatility, indicating a period of consolidation or low price fluctuations. Conversely, wider bands suggest high volatility, indicating larger price swings and increased market uncertainty.
It’s crucial to remember that Bollinger Bands are not a standalone trading system. They are best used in conjunction with other technical indicators and fundamental analysis to confirm trading signals and reduce the risk of false signals. The effectiveness of Bollinger Bands can vary depending on the asset being analyzed and the market conditions.
MACD (Moving Average Convergence Divergence)
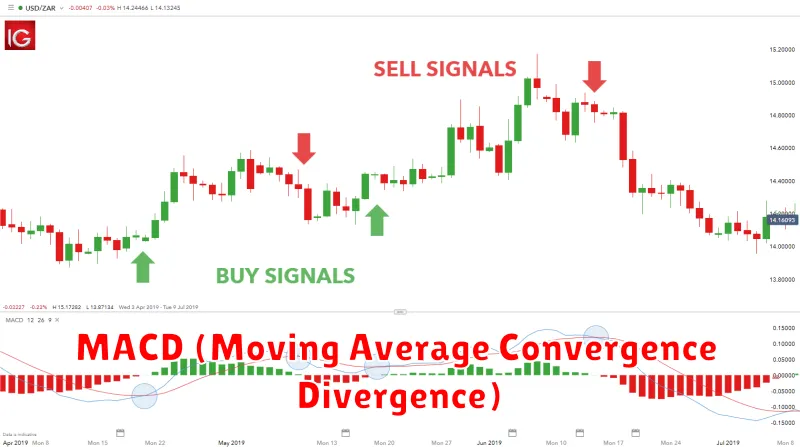
The Moving Average Convergence Divergence (MACD) is a popular momentum indicator used in technical analysis of financial markets. It helps traders identify potential changes in momentum and potential buy and sell signals.
The MACD is calculated by subtracting the 26-period Exponential Moving Average (EMA) from the 12-period EMA. This difference is then plotted as a line on a chart. A second line, called the signal line, is typically a 9-period EMA of the MACD line itself.
Interpreting the MACD: Traders often look for crossovers between the MACD line and the signal line. A bullish crossover occurs when the MACD line crosses above the signal line, suggesting a potential upward trend. Conversely, a bearish crossover occurs when the MACD line crosses below the signal line, hinting at a potential downward trend.
Divergence: Another important aspect of MACD analysis is divergence. Bullish divergence occurs when the price makes lower lows, but the MACD makes higher lows. This suggests potential weakness in the downtrend and a possible price reversal. Bearish divergence, conversely, occurs when the price makes higher highs, but the MACD makes lower highs, indicating potential weakness in the uptrend and a possible reversal.
Limitations: While the MACD is a valuable tool, it’s crucial to remember it’s not a perfect predictor. It’s most effective when used in conjunction with other technical indicators and fundamental analysis. False signals can occur, and relying solely on the MACD for trading decisions can be risky.
In summary, the MACD is a powerful momentum indicator that can provide valuable insights into market trends and potential price reversals. However, it’s essential to use it judiciously and in combination with other analytical methods for informed decision-making.
Fibonacci Retracement
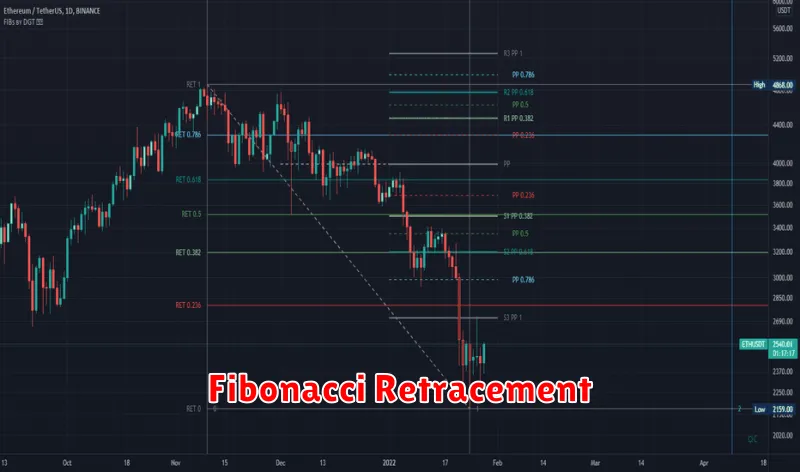
The Fibonacci retracement is a popular tool used in technical analysis to identify potential support and resistance levels in a financial market. It’s based on the Fibonacci sequence, a series of numbers where each number is the sum of the two preceding ones (e.g., 0, 1, 1, 2, 3, 5, 8, 13, etc.).
In technical analysis, these numbers are expressed as ratios (0.236, 0.382, 0.5, 0.618, 0.786, and 1.0) and are used to plot horizontal lines on a price chart. These lines represent potential areas where the price might pause, reverse, or consolidate during a trend.
To apply a Fibonacci retracement, you need to identify a significant high and a significant low (or vice-versa) in the price chart. The tool then calculates the retracement levels based on the difference between these two points. For example, if the high is $100 and the low is $50, the 0.382 retracement level would be calculated as $50 + 0.382 * ($100-$50) = $69.1.
Support levels are typically found at the retracement levels during an uptrend, while resistance levels are often observed at these levels during a downtrend. Traders use these levels to potentially enter long positions (buying) near support or short positions (selling) near resistance.
It’s crucial to remember that Fibonacci retracement is just one tool among many. It shouldn’t be relied upon solely for making trading decisions. It’s best used in conjunction with other technical indicators and fundamental analysis to confirm trading signals and reduce risk.
Key Considerations:
- Not all retracements are created equal; some levels are more significant than others (e.g., 0.382 and 0.618 are frequently observed).
- Retracements can be imprecise; the price may not always bounce exactly at these levels.
- Combine with other forms of analysis for increased accuracy.